

Network Geolocation Visualizations
Here's a snapshot of an ongoing Argus Project project to develop native Mac OS X (snow leopard) applications for near real-time situational awareness. In about 3 - 4months, we should have much of this available as Open Source code. We use argus data (of course), Cocoa, and OpenGL, to build interactive visualizations. This framework provides us with a 3D environment for visualizing argus() data. If you have any ideas, interest, whatever, please send email to the argus developers list.
This specific application, attaches to an argus() data source that contains lat/lon geolocation labels the IPv4 addresses . The app holds a 120 second (configurable of course) cache of the data records it receives, and then aggregates the data to generate the list of individual IP addresses, along with their lat/lon descriptors. The app displays little push-pins for IP address's based on their lat/lon values on an interactive globe that provides some detail, so you can zoom in and out. This display is reading data for the realtime network activity seen at QoSient WHQ (world headquarters), but it can also read files, so visualizing historical data is very simple.
The 3D rendering system is VMD's scenegraph architecture ported to Objective-C and Cocoa. With the VMD framework, we've got lots of graphics support, multiple light sources, stereo display support, depth cueing, multiple projections, etc.... The earth data and cloud data are texture mapped to separate OpenGL Quadrics, the earth data is from JHT's Planetary Pixel Emporium and the clouds are updated every 3 hours from Xplanet. The data is basic ratop(), rasqlinsert(), racluster() style data for tracking IP addresses. radium() labels the IP addresses with lat/lon data, and this app, provides the lat/lon to the OpenGL engine that places push-pins at the advertised place on the map. Still very early in its development. I'll put up a movie in the next set of days.
Resulting Image
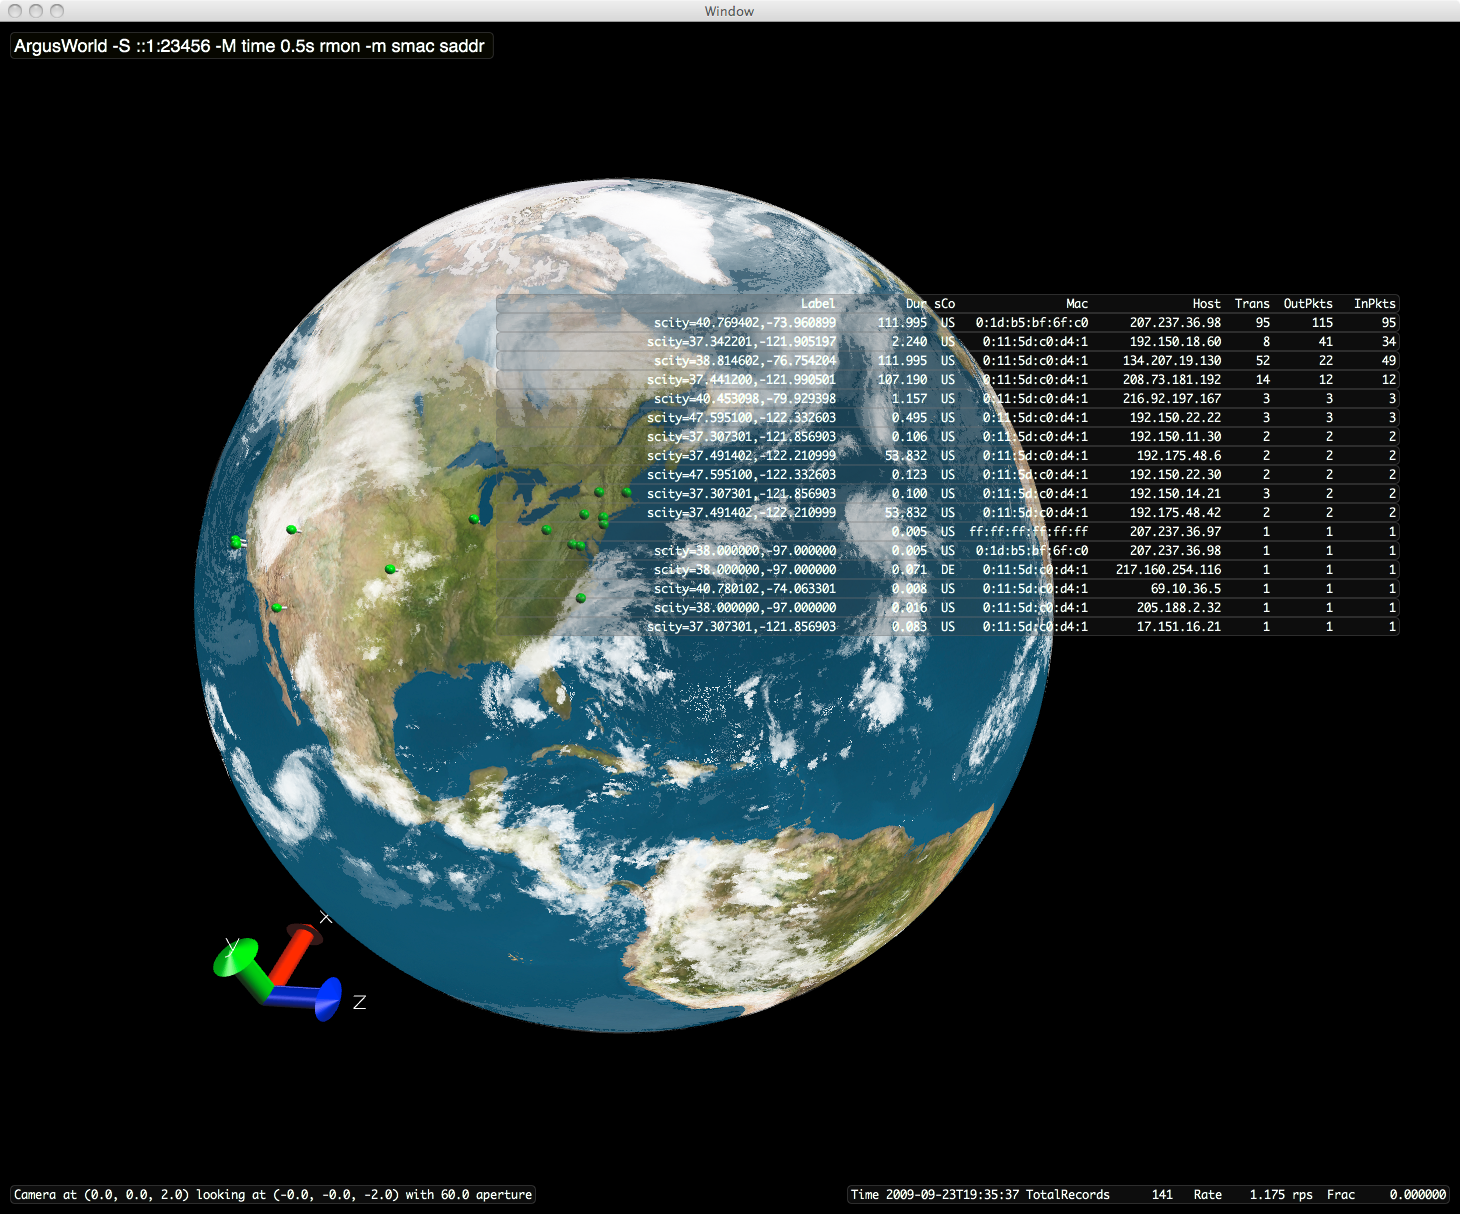
This screen is fully interactive, you can rotate, zoom the push-pins are selectable, etc.... There are "hot keys" to turn on/off the visibility of the clouds, the earth, the flow table and the push-pins. Any suggestions as to what would be cool for this application would be most appreciated. My next step is to show instantaneous load/rate along paths between two nodes, so ..., hopefully that will only take a few days to do.