Data Aggregation Study
Graphing the time-series for the load or rate of a given flow is very useful for reporting and visualizing the behavior of network traffic. Argus provides a great deal of flexibility in graphing flow data, and an important component of graphing time series data is the time resolution; the width of a data point on the y-axis.
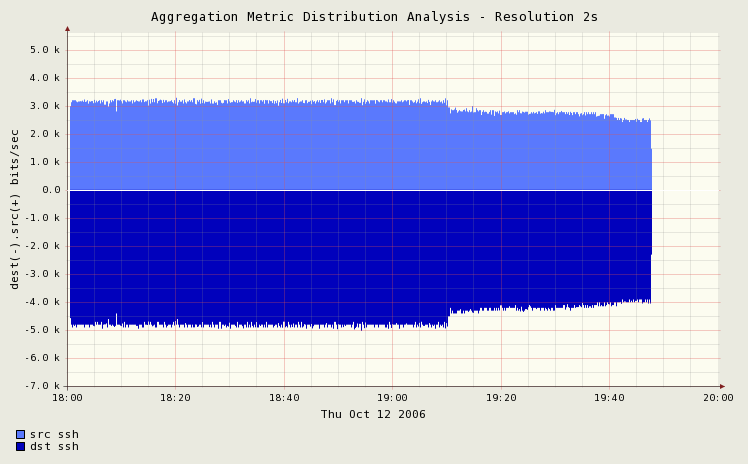
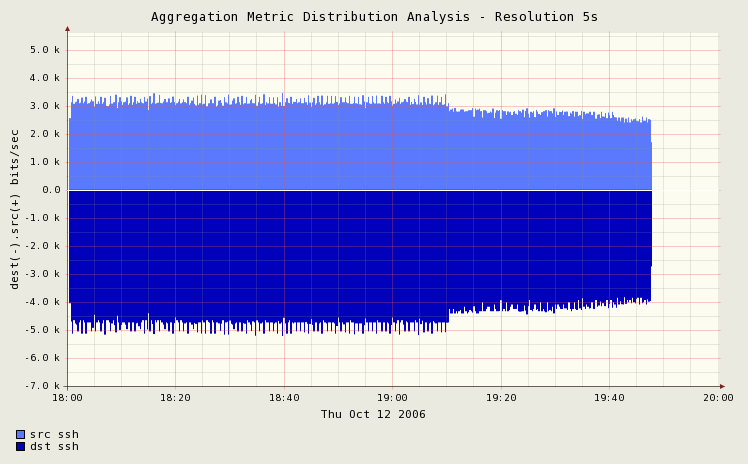
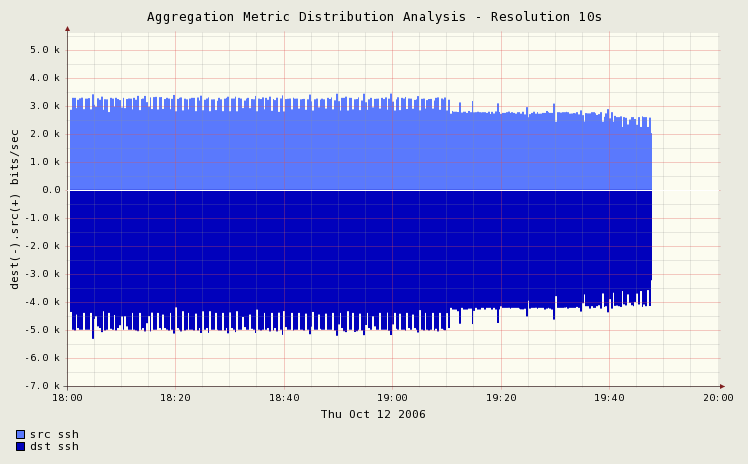
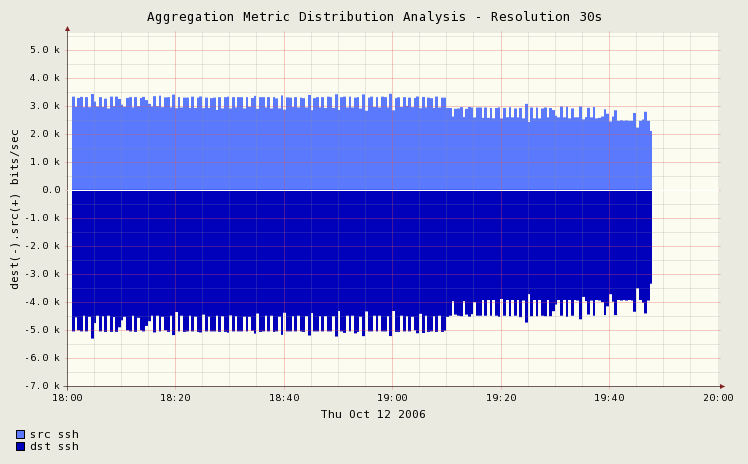
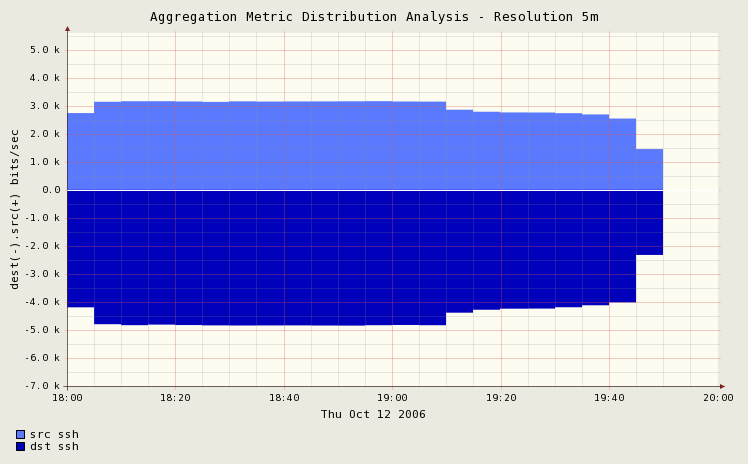
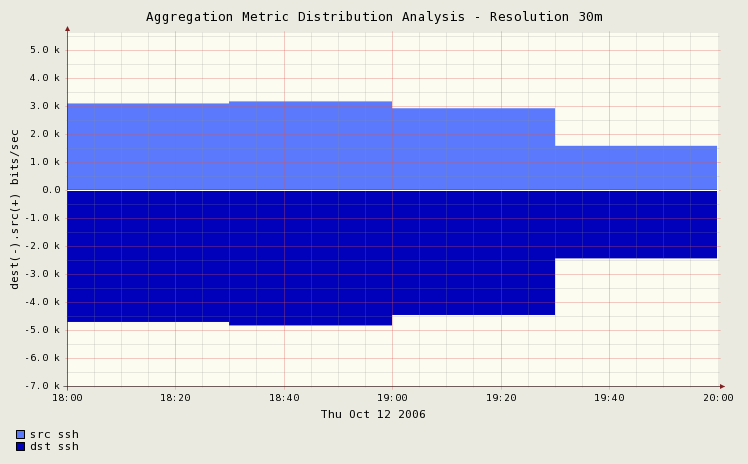
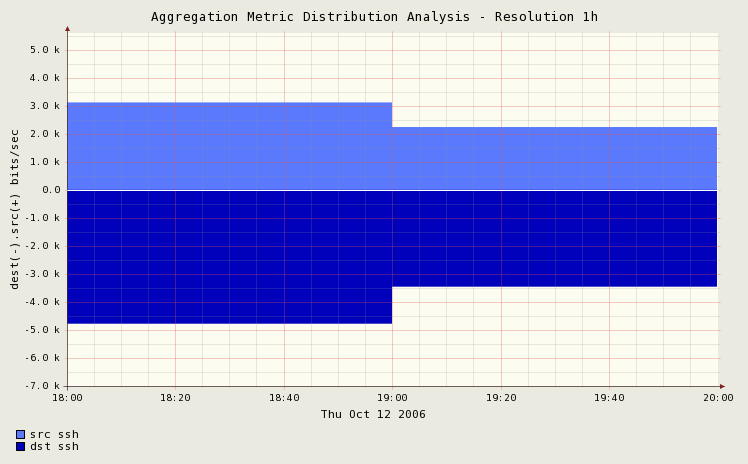
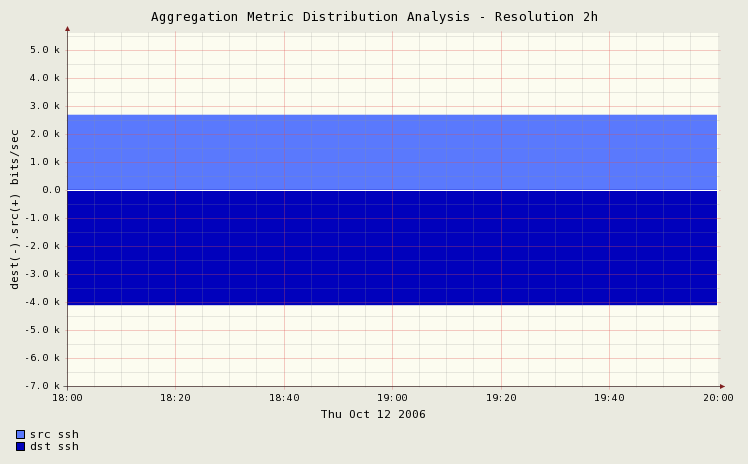
In this series of graphs, we are plotting the total bits per second used by about 1750 SSH flows between two hosts, during a 2 hour period. Each graph was generated from the same source argus data with the same parameters, except for the time resolution. By making the graph 'coarser', the average value for the SSH load becomes a 'rougher' estimate of the actual instantaneous load. This simple strategy is useful for coarse representations of trending characteristics.
The purpose of these graphs is to show that the complete set of argus aggregation tools, including ragraph() can faithfully represent the data in multiple time granularities, with good results. While there are expected aliasing artifacts, the resulting data does preserve a number of flow trends such as periodic 'surges', where ssh flows overlapped.
Graph Data Generation
We use ra() or rasql() to select the data for our study from a daily archive. For this study we just needed a lot of similar flow for a period of time. We grabed all the flow status record for a bunch of SSH flows over a period of 2 hours. We ended up with 1750 flow records, and that's a good number.
In order to generate all the graphs, we ran a simple bash script:
bash> for i in 1s 2s 5s 10s 15s 20s 30s 45s 1m 2m 5m 10m 15m 20m 30m 1h 2h; do echo $i ; \
ragraph rate dport -M $i -r output.file -t 18-20 -m proto dport -upper 5000 -lower 7000 \
-title "Aggregation Metric Distribution Analysis - Resolution $i" ; \
mv ragraph.png aggregation.$i.png; done
And voilà!!!!! Here are the 9 resulting graphs.
Resulting Graphs
 |
 |
 |
 |
 |
 |
 |
 |
 |
The results are very good, even when we aggregate at 5 minute intervals we still get excellent preservation of the trending that we saw at 2 second intervals. We derive some of our standard practicesm like file sizes every 5 mintues in the archive from these types of measurements.